


Who am I?
Geography & International Affairs Student at GW
Who they are.
Jordan is a masters Geography student at University of Alabama, and Maggi is an undergraduate Atmospheric Sciences student at UAH
Where did I study landslides?
Hunstville, Alabama at the National Space Science Technology Center for NASA DEVELOP
Project Partners
NASA SERVIR Applied Sciences Team & Coordination Office
The Regional Center for Mapping of Resources for Development
Malawi
Topography, climate, seismotology, agriculture, and energy.
Disaster mitigation and management context
Disasters~development
Study Objectives
Update Global Landslide Catalog
Generate Susceptibility and Exposure Maps
Conduct Rainfall Assessment
Earth Observations
TRMM-PR
GPM-IMERG
Landsat 5-TM & Landsat 8-OLI
SRTM-v3 C-band
Global Landslide Catalog
Google Earth
Historical Slider
Time
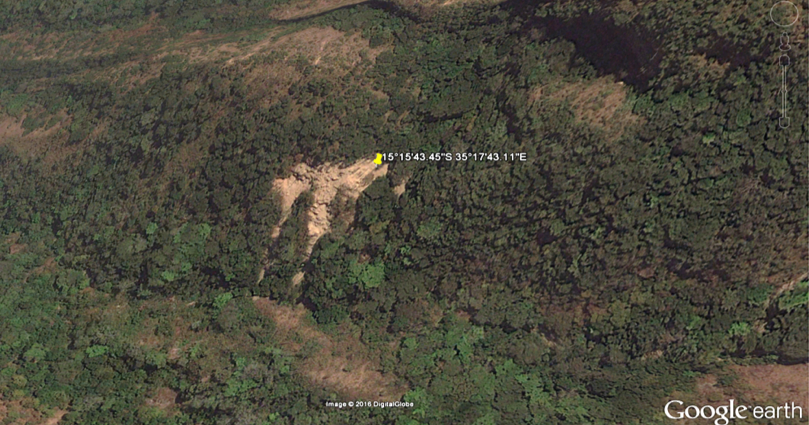
Source: Google Earth
Landslide Susceptibility & Exposure Maps
Data Aquisition
Create topographic, land cover, soil type, and other landslide related datasets and landslide point layer.
Data Processing
Create Susceptibility Map using the Maximum Entropy Model, and intersect Susceptibility Map with LandScan to create Exposure Map.
Accuracy Assessment
Sample 25% of landslide points, consider “true” if susceptibility above 0.50. “True” points divided by all sampled points is accuracy.
Map Results
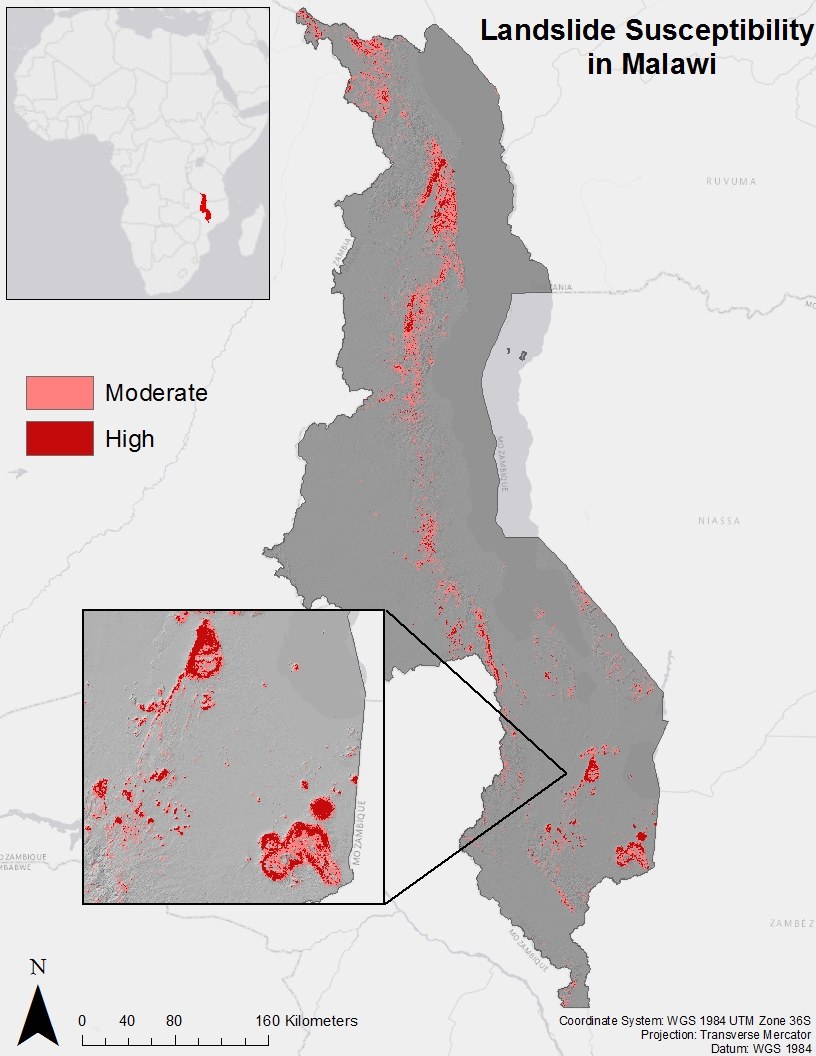
Susceptibility in northwest, central, and southeastern Malawi.
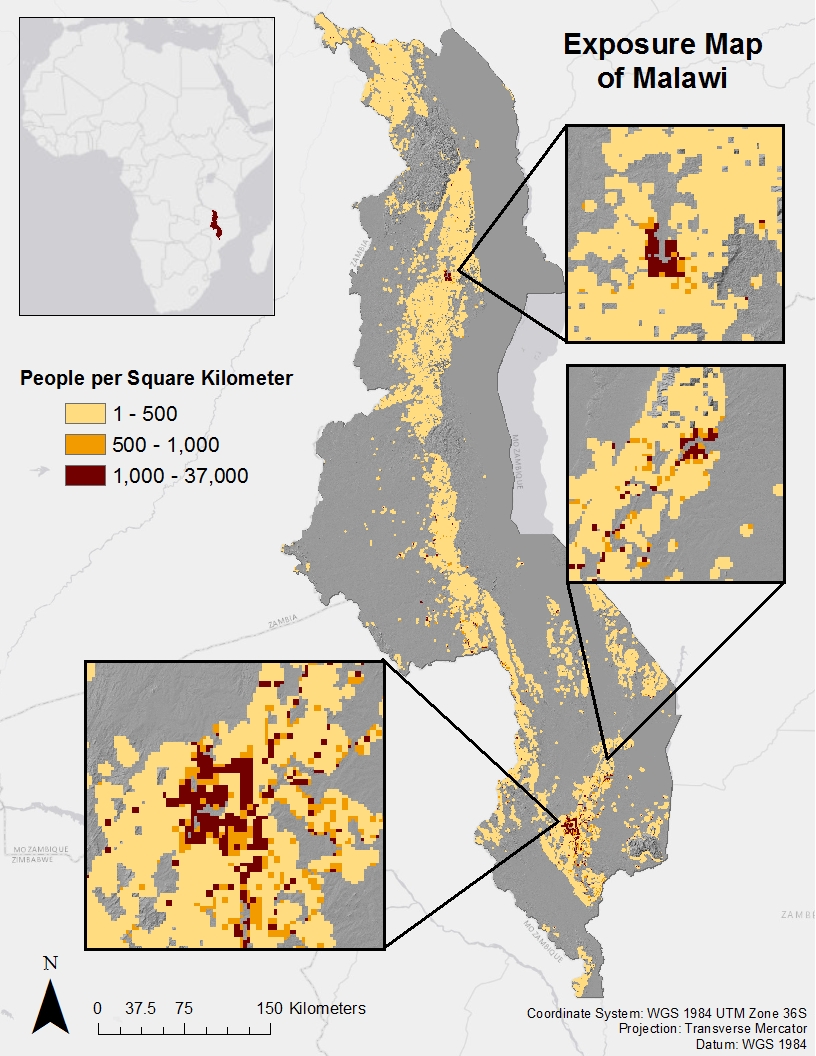
Source: NASA DEVELOP
Exposed cities include Blantyre, Zomba, and Mzuzu.
13 million people are in susceptible areas.
Rainfall Assessment
Data Aquisition
Download TRMM, GPM, and CHIRPS 2.0 at monthly accumulation and average daily precipitation per month.
Data Processing
Extract values at 500 random points for all datasets. Subset upper quartile for each dataset.
Data Analysis
Calculate and report correlation coefficient for GPM & CHIRPS 2.0 and TRMM & CHIRPS 2.0.
Rainfall Assessment Results
| Data Source | Temporal Resolution | Avg. Correlation | Min. Correlation | Max Correlation | ||||||||
|---|---|---|---|---|---|---|---|---|---|---|---|---|
| TRMM |
|
|
|
|
||||||||
| GPM |
|
|
|
|
||||||||
| Study Period: March 2014 - January 2015 | ||||||||||||
What I learned
Modeling Landslides in Challenging
Preparing Data is very important
Teamwork is crucial
Future work
Test model at finer scales
Incorporate Inundation Duration Curves
Thanks!
Contact: m.grossman1813@gmail.com
Site: maxgrossman.github.io
All opinions, findings, and conclusions or recommendations expressed are mine and do not necessarily reflect the views of the National Aeronautics and Space Administration.